
Tesla Model 3 LR Vs Hyundai Ioniq 5: Fast Charging Comparison
It's time for an in-depth, fast charging analysis of the titans.


Here is the long-awaited analysis of DC fast charging of the top of the line 2021 Tesla Model 3 Long Range AWD and a comparison with a new heavyweight contender - the Hyundai Ioniq 5.
In the case of the of the Model 3, we will actually take a look at the data from two cars, the 2019 and 2021 versions, tested by our very own Tom Moloughney at V3 (250 kW) Tesla Superchargers in the U.S.
The Hyundai Ioniq 5 data comes from the previous report, in which we have shown that it offers one of the best, if not the best, fast-charging "speed" ever.
Let's get into details, starting with the 2021 Tesla Model 3 LR AWD.
Charging power vs state-of-charge (SOC)
The 2021 Tesla Model 3 LR AWD has a very good fast charging curve. It starts strong at almost 100 kW and quickly increases towards the peak of 250 kW.
Unfortunately, the peak does not last long - between 10% to roughly 18% SOC, after which we see a quick decrease, to the next stable level of around 140 kW from around 28% to around 40% SOC. The the charging power decreases gradually.
At around 80% SOC it's just a little bit over 50 kW and just 36 kW at 90%. It means that in the case of Tesla, it's worth it to start charging at 5-10% SOC and not pursue a particularly high SOC level (beyond 80% or even 70% SOC) if it's not necessary.

State-of-charge (SOC) vs time
Charging from 20% to 80% SOC took about 26 minutes. You would need more than a half an hour to get from 80% to 100%, which indicates how much slower it is than in the initial part.
The chart below is only for illustrative purposes:

Average charging power vs state-of-charge (SOC)
The average power in the very important range from 20% to 80% SOC is 106 kW, which is 42% of the peak value.
That's one of the best results on the market, but not the highest. The chart shows us also that the average is way lower at higher SOCs than in the beginning.

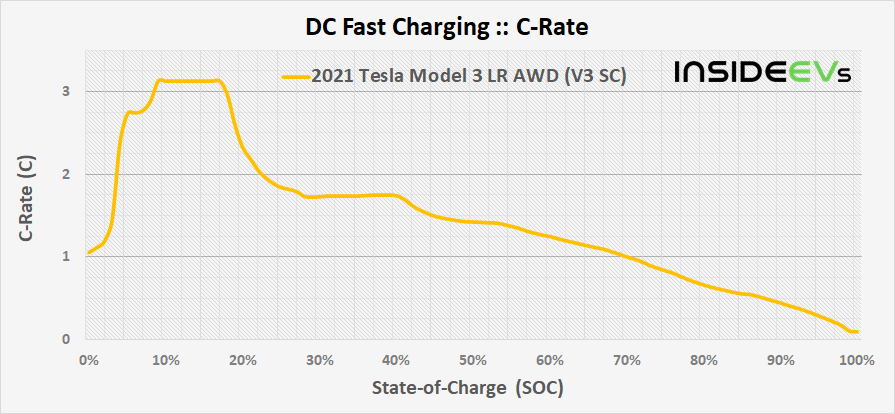
C-rate vs state-of-charge (SOC)
The peak C-rate* - charging power in relation to the total battery capacity of 80 kWh (our guess) - is about 3.1C.
The average C-rate when charging from 20% to 80% SOC is much lower: 1.3C.
*C-rate tells us how the charging power relates to the battery pack capacity. For example: 1C is 1-hour charging power (current), when the power value in kW is equal to the battery pack capacity in kWh. 2C would be enough to recharge in half an hour.
The assumed net battery capacity of 72.6 kWh stands for about 91% of the total battery capacity.
Range replenishing speed vs state-of-charge (SOC)
The rate of range replenishing depends on the energy consumption and the energy consumption depends on the use case.
We have plenty of data for the 2021 Tesla Model 3 LR AWD, including our very own IEVs 70 mph range test that resulted in 310 miles (not a new car - a year old and with about 15,000 miles):
- WLTP
Taking into consideration the WLTP range of 614 km (382 miles) and available battery capacity of 72.6 kWh, we can assume energy consumption of 118 Wh/km (190 Wh/mile).
The effective average speed of range replenishing when charging from 20% to 80% SOC would be 14.9 km/minute (9.3 miles/minute). - EPA Combined range
Taking into consideration the EPA Combined range of 353 miles (568 km) and available battery capacity of 72.6 kWh, we can assume energy consumption of 206 Wh/mile (128 Wh/km).
The effective average speed of range replenishing when charging from 20% to 80% SOC would be 8.6 miles/minute (13.8 km/minute). - EPA Highway range
Taking into consideration the EPA Highway range of 333.8 miles (537 km) and available battery capacity of 72.6 kWh, we can assume energy consumption of 217 Wh/mile (135 Wh/km).
The effective average speed of range replenishing when charging from 20% to 80% SOC would be 8.1 miles/minute (13 km/minute). - IEVs 70 mph range test
Taking into consideration the IEVs 70 mph range test result of 310 miles (499 km) and available battery capacity of 72.6 kWh, we can assume energy consumption of 234 Wh/mile (146 Wh/km).
The effective average speed of range replenishing when charging from 20% to 80% SOC would be 7.5 miles/minute (12.1 km/minute).
Thanks to outstanding efficiency, the car notes extremely high range replenishing speed in the initial stage of charging and quite good overall. In the best case scenario, you can get additional 100 km (62 miles) of range in less than 4 minutes.

Ultimate DC fast charging card
Here is our ultimate charging card for the 2021 Tesla Model 3 LR AWD that shows an estimated time of charging to add a certain number of SOC percent points, average charging power, added energy and added range for listed SOC ranges. Click here to enlarge the image.

The matrix above, might be helpful from the user perspective, but be aware that it's just an estimate from a particular test, with measure and calculation uncertainty probably above 5%. On top of that comes variation for individual case - car (version, age/battery state-of-health), charger, ambient and battery temperature, software version and more (including cabin heating/cooling during charging). Another thing is that the charging curve might shift when charging starts at a lower/higher SOC.
Comparisons with other EVs

Comparison of charging power
Now we will take a look at the 2021 Tesla Model 3 LR AWD in comparison to the same version from 2019 and the Hyundai Ioniq 5.
The first surprise is that the 2021 model year version has a significantly different charging curve compared to the 2019 model year version in the initial part. The old Model 3 was able charge at a higher power right from the start and maintained the same 250 kW for longer (5-23% SOC).
At this point we don't know what caused the difference - is it a general thing or related just to the tested cars/software/station. What we do know is that in the case of Standard Range Plus cars, the new versions from Fremont appear to charge slower as well. Maybe the more energy dense battery cells from Panasonic charge at a bit of a lower rate?
In comparison with the Hyundai Ioniq 5's "factory charging curve" (haven't tested it yet), both Model 3s are left behind as soon as 30% SOC (the initial part of 20-30% is still higher on the Tesla side). Battery size, in all cases, is similar.
We guess that with a peak of 225 kW maintained in the middle of the process (from about 30% to over 50% SOC), the Hyundai Ioniq 5 will beat Teslas.

Comparison of State-of-charge (SOC) vs time
The next chart (not the most accurate though), confirms that in the first part, the Tesla Model 3 LR has a big advantage over the Hyundai Ioniq 5, however the South Korean car is the first that hits the 80% SOC mark - after about 15 minutes.
The difference compared to Teslas is roughly 9-11 minutes (24 minutes 2019 Model 3, 26 minutes 2021 Model 3). That 10 minute difference is a huge gap in the fast charging. A big win for the Hyundai Ioniq 5 for now, but we need independent test samples to confirm that.
A separate thing is that the older Model 3 is ahead of the new one.
*The starting points were adjusted to the lowest common SOC.

Comparison of C-rate
With similar battery sizes for all three cars (see the table below), the peak C-rate values are around 3. The 2019 Tesla Model 3 LR AWD was even able to reach 3.3 and maintain it. That's more than the Hyundai Ioniq 5.
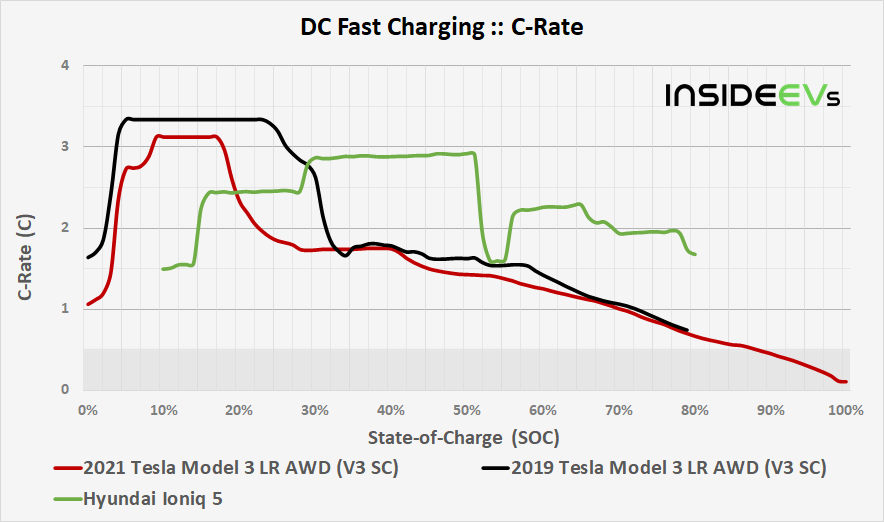
The key point is that the average charging power in the 20-80% SOC range is significantly higher in the Hyundai Ioniq 5 - 180 kW compared to 106-113 kW in Teslas. The time is also much shorter in the Hyundai Ioniq 5:
| DC Fast Charging Comparison by InsideEVs | ||||||
| Model [data source] |
Drive / Battery (kWh) |
Max Power |
Avg Power (20-80%) |
Max C-Rate |
Avg C-Rate (20-80%) |
Time (20-80%) |
| 2019 Tesla Model 3 LR AWD (V3 SV) [Tom Moloughney] |
AWD 75 kWh |
250 kW | 113 kW | 3.3 | 1.5 | 24 min |
| 2021 Tesla Model 3 LR AWD (V3 SV) [Tom Moloughney] |
AWD 80 kWh |
250 kW | 106 kW | 3.1 | 1.3 | 26 min |
| 2021 Hyundai Ioniq 5 [Hyundai] |
AWD 77 kWh |
225 kW | 180 kW | 2.9 | 2.3 | 15 min |
Comparison of range replenishing speed
We will compare the range replenishing speed of the two Tesla Model 3 using the EPA Highway range rating as a base. The new version has a little bit of more range - 333.8 miles (537 km) compared to 297.2 miles (478 km) - which reduces the difference in power.
Overall, the 2019 model year version is a few percent quicker in the 20-80% SOC range (see the table below):

More interesting to us is the comparison with the Hyundai Ioniq 5 - using WLTP (the only common range rating) as a base.
As it turns out, despite the higher WLTP range of 614 km (382 miles) vs about 480 km (298 miles), the 2021 Tesla Model 3 LR AWD is not able to beat the Hyundai Ioniq 5 in the 20-80% SOC window. It means that the slightly bigger and less efficient Model Y LR AWD will not beat the Ioniq 5 either.

The Hyundai Ioniq 5 averages almost 20 km/min (12.4 mi/min), which is over 33% faster rate than in the case of the 2021 Tesla Model 3 LR AWD at 14.9 km/min (9.3 mi/min):
| DC Fast Charging Comparison by InsideEVs | ||||||
| Model [data source] |
Drive / Battery (kWh) |
Avg Power (20-80%) |
WLTP range rep. rate (20-80%) |
EPA range rep. rate (20-80%) |
EPA Hgw range rep. rate (20-80%) |
IEVs 70mph range rep. rate (20-80%) |
| 2019 Tesla Model 3 LR AWD (V3 SV) [Tom Moloughney] |
AWD 75 kWh |
113 kW | 13.9 km/min (8.7 mi/min) |
13.4 km/min (8.3 mi/min) |
13 km/min (8.1 mi/min) |
|
| 2021 Tesla Model 3 LR AWD (V3 SV) [Tom Moloughney] |
AWD 80 kWh |
106 kW | 14.9 km/min 9.3 mi/min |
13.8 km/min (8.6 mi/min) |
13 km/min (8.1 mi/min) |
12.1 km/min (7.5 mi/min) |
| 2021 Hyundai Ioniq 5 [Hyundai] |
AWD 77 kWh |
180 kW | 19.9 km/min 12.4 mi/min |
|||
Conclusions
Our conclusion for today is that the 2021 Tesla Model 3 Long Range AWD offers great charging performance. Unfortunately, the peak charging power is not maintained too long.
The data suggests that the versions produced in the previous years charged even faster, but this requires some more evidence.
The comparison with the Hyundai Ioniq 5 reveals that there is no match for the South Korean car either in terms of the average charging power and the range replenishing speed in 20-80% SOC window. If the Ioniq 5 charges quicker than Model 3, the range replenishing speed will be better also compared to one of its main competitors, the Model Y.
Finally, we must remember that the Tesla charging results were achieved at a V3 Tesla Supercharger (250 kW). Not all Tesla Superchargers are V3. In Europe, Tesla Model 3/Model Y can use also CCS2 fast chargers, but the charging output (despite power of up to 350 kW) might not be as high as on the V3 Superchargers. We will try to get into it in one of the next analysis.
| 2021 Tesla Model 3 LR AWD (V3 SV) :: DC Fast Charging Summary by InsideEVs Drive: AWD; Battery pack (net / total): 72.6 / 80 kWh [Data source: Tom Moloughney] |
|
| Peak Power Peak C-rate Average Power (20-80% SOC) Average-to-Peak Power Average C-rate (20-80% SOC) Time (20-80% SOC) |
250 kW 3.1 106 kW 42% 1.3 26 min |
| Range Replenishing Speed (Average 20-80% SOC): | |
| WLTP EPA Combined EPA Highway InsideEVs 70 mph |
14.9 km/min (9.3 mi/min) 13.8 km/min (8.6 mi/min) 13 km/min (8.1 mi/min) 12.1 km/min (7.5 mi/min) |
See also
General info:
* Some values on the charts are estimated from the data source.
** Temperature of the battery cells might highly negatively affect charging capabilities. We don't have data about temperatures of the battery at the beginning and during the charging process. In cold or hot weather, as well as after driving very dynamically, charging power might be significantly lower than shown on the charts (in extreme cases charging might be impossible until the battery temperature will not return to an acceptable level).
See Tom Moloughney's Tesla Model 3 LR AWD charging tests:

RECOMMENDED FOR YOU
This Tesla Model 3 Battery Chemistry Ages Better Than The Rest
MG Is Putting Semi-Solid Batteries In Its Next Plug-In Hybrids
The 16 Cheapest Electric Cars In 2026
GM Wants To Lower EV Owners’ Energy Bills With Smarter Home Charging
The Best EV Lease And Finance Deals In July 2026
The Most Important Range Rover EV Is Coming Sooner Than We Thought
This 2023 Tesla Model 3 Has The 'Durable' Battery. It Still Degraded