
Here's Our Ultimate DC Fast Charging Card: Do You Approve?
A complex matrix that should be helpful from the user perspective.


In recent months we have started to analyze the DC fast charging of electric vehicles more deeply, which has resulted in a new series of fast charging analysis.
Using data from our own tests (like for example of the Volkswagen ID.4 or Ford Mustang Mach-E) and third-party sources, we are extracting key results and drawing charts to better understand the charging performance and compare models side-by-side.
The fast-charging analysis was evolving, basically each time, and becoming more and more comprehensive, including additional topics. Most recently we have added the charging curves on the time scale (a thing that readers were asking for as a supplement to the charts with the state-of-charge scale).
Today, we present a completely new visualization - also developed to address requests from the readers - to show charging results in a way that should be more interesting from the user perspective. Meet the Ultimate DC fast charging card, probably the most complex charging matrix you have ever seen.
Ultimate DC fast charging card
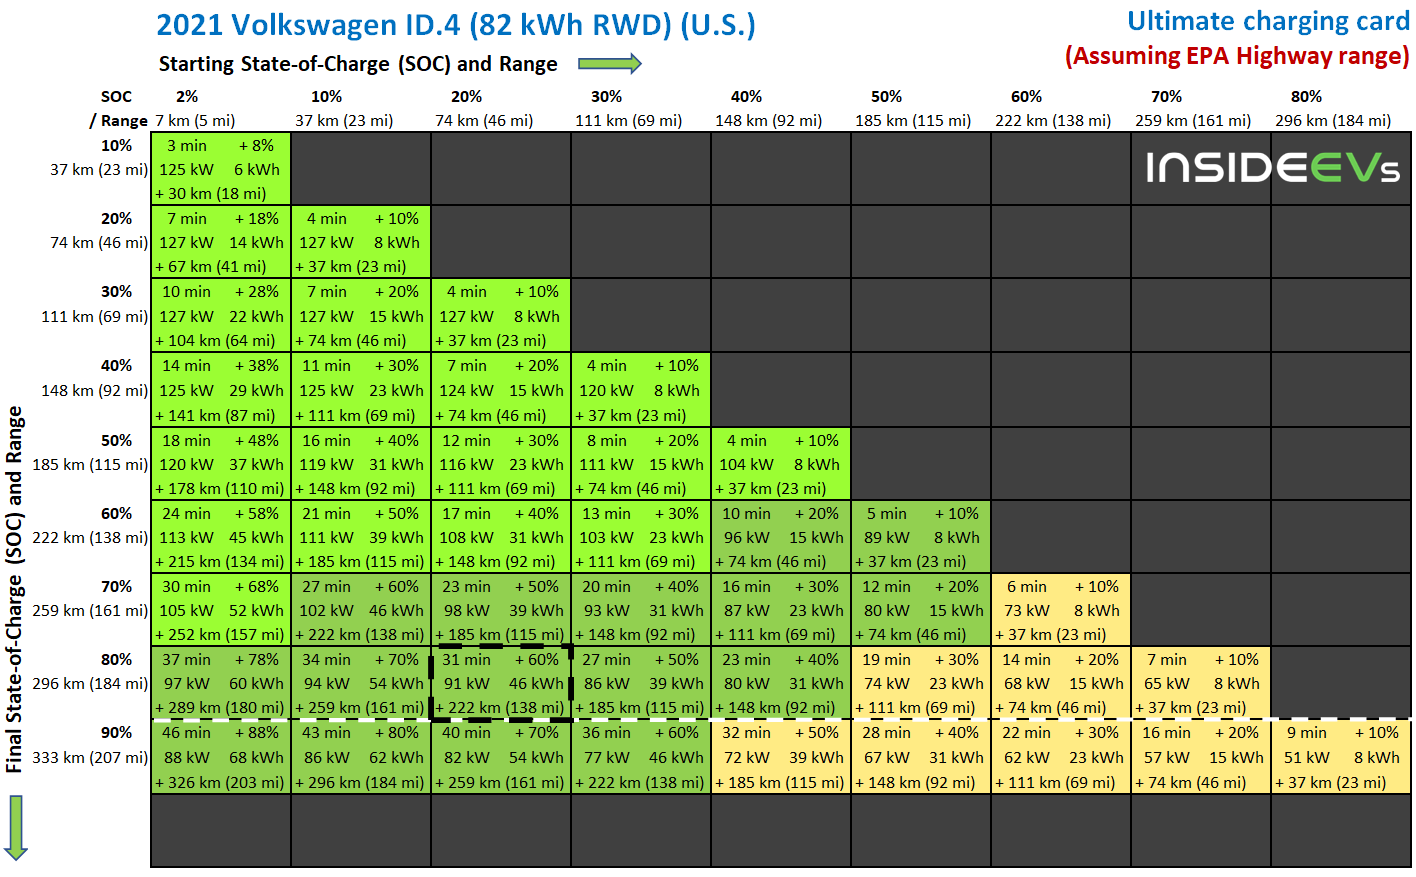
The ultimate charging card shows an estimated time of charging required to reach a certain State of Charge (SOC) depending on the starting SOC, plus an estimated starting/final range (in selected range tests).
In each box you can see the required time, added SOC points, average charging power, added energy and added range for listed SOC ranges. The color of the boxes changes every 20% of the peak value.
Taking the recently tested Volkswagen ID.4 (RWD, 82 kWh battery version) as an example, we present the results for EPA Highway range rating of 230 miles/370 km. In this case, the matrix is mostly green and slightly yellow, as the charging curve is pretty flat up to 92% SOC. Click here to enlarge the image.
For example, charging from 20 to 80% SOC will take 31 minutes to add 60% points of SOC. The average charging power is 91 kW and about 46 kWh of energy will be replenished. The range will increase by 222 km (138 miles), assuming EPA Highway rating.
The matrix above might be helpful from the user perspective, but be aware that it's just an estimate from a particular test, with measure and calculation uncertainty probably above 5%. On top of that comes variation for individual cases - car (version, age/battery state-of-health), charger, ambient and battery temperature, software version and more (including cabin heating/cooling during charging). Another thing is that the charging curve might shift when charging starts at a higher SOC.
Please feel free to leave us a comment as to whether it's something you like, find useful and if you would like to see more of our ultimate matrix for other models in our analysis.
See also
RECOMMENDED FOR YOU

The Best EV Lease And Finance Deals In July 2026
Tesla Breaking Off Its China Business? Musk Calls It 'Absurdly Fake News'
VW Wants Higher Tariffs After Chinese PHEVs Overtake Its Best-Seller in Europe
‘Largest Supply Disruption In History’: High Oil Prices Drove Record EV Sales In 50 Countries
Volkswagen's Cheapest EVs Are Already A Hit: 70,000 Orders And Counting
The Ferrari Luce EV Proves The Haters Wrong
All The EVs That Got Canceled Or Delayed In 2025 And 2026 (Updated)